Fleet Operations
Transforming a complex maritime operations platform into a simpler, smarter, and more connected experience for ship and shore teams.
UX Strategy
Product Design
UX Research
AI-Assisted Workflows
Overview
Fleet Operations is a modern maritime operations platform designed to bring voyage reporting, fleet monitoring, crew operations, compliance, defects, fuel, and performance insights into one connected ecosystem. The project involved redesigning the existing Product experience, which had complex workflows, long reporting forms, repetitive data entry, and limited visibility across daily vessel operations. Our goal was to simplify the experience without removing the operational depth required by maritime teams.
Impact
More connected, action-driven operations ecosystem
Services
UX Strategy · Product Design · UX Research · AI-Assisted Workflows
Maritime Tech
Industry vertical
The Challenge
Maritime Operations had complex workflows, long reporting forms with 100–150 fields, repetitive data entry, and limited visibility across daily vessel operations. Masters and shore teams carried a heavy review workload with no clear signal for what changed or needed attention. The opportunity was to turn a collection of disconnected operational tools into one connected maritime ecosystem.
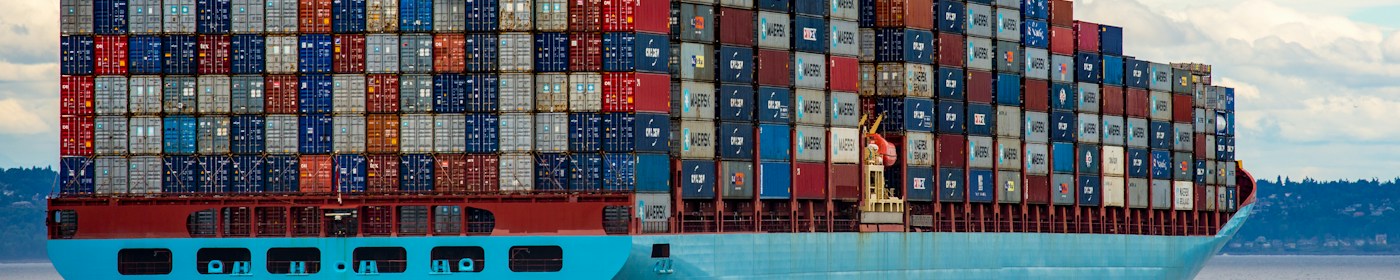
Connected Ecosystem
12+ Modules. One Connected Experience.
Instead of treating every operational function as a separate product, we created a connected ecosystem across the fleet.

Process
Research and Insights
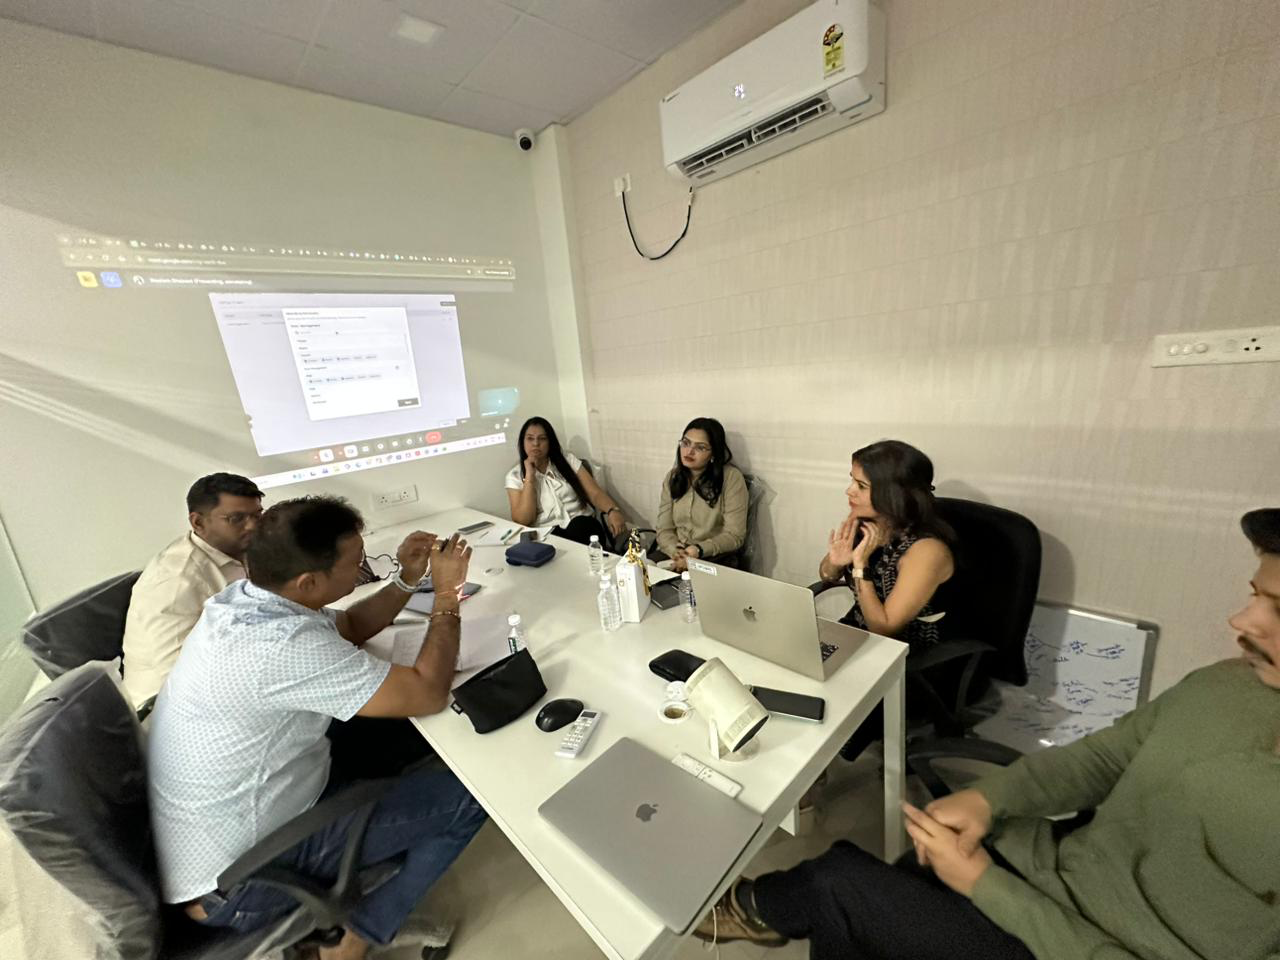
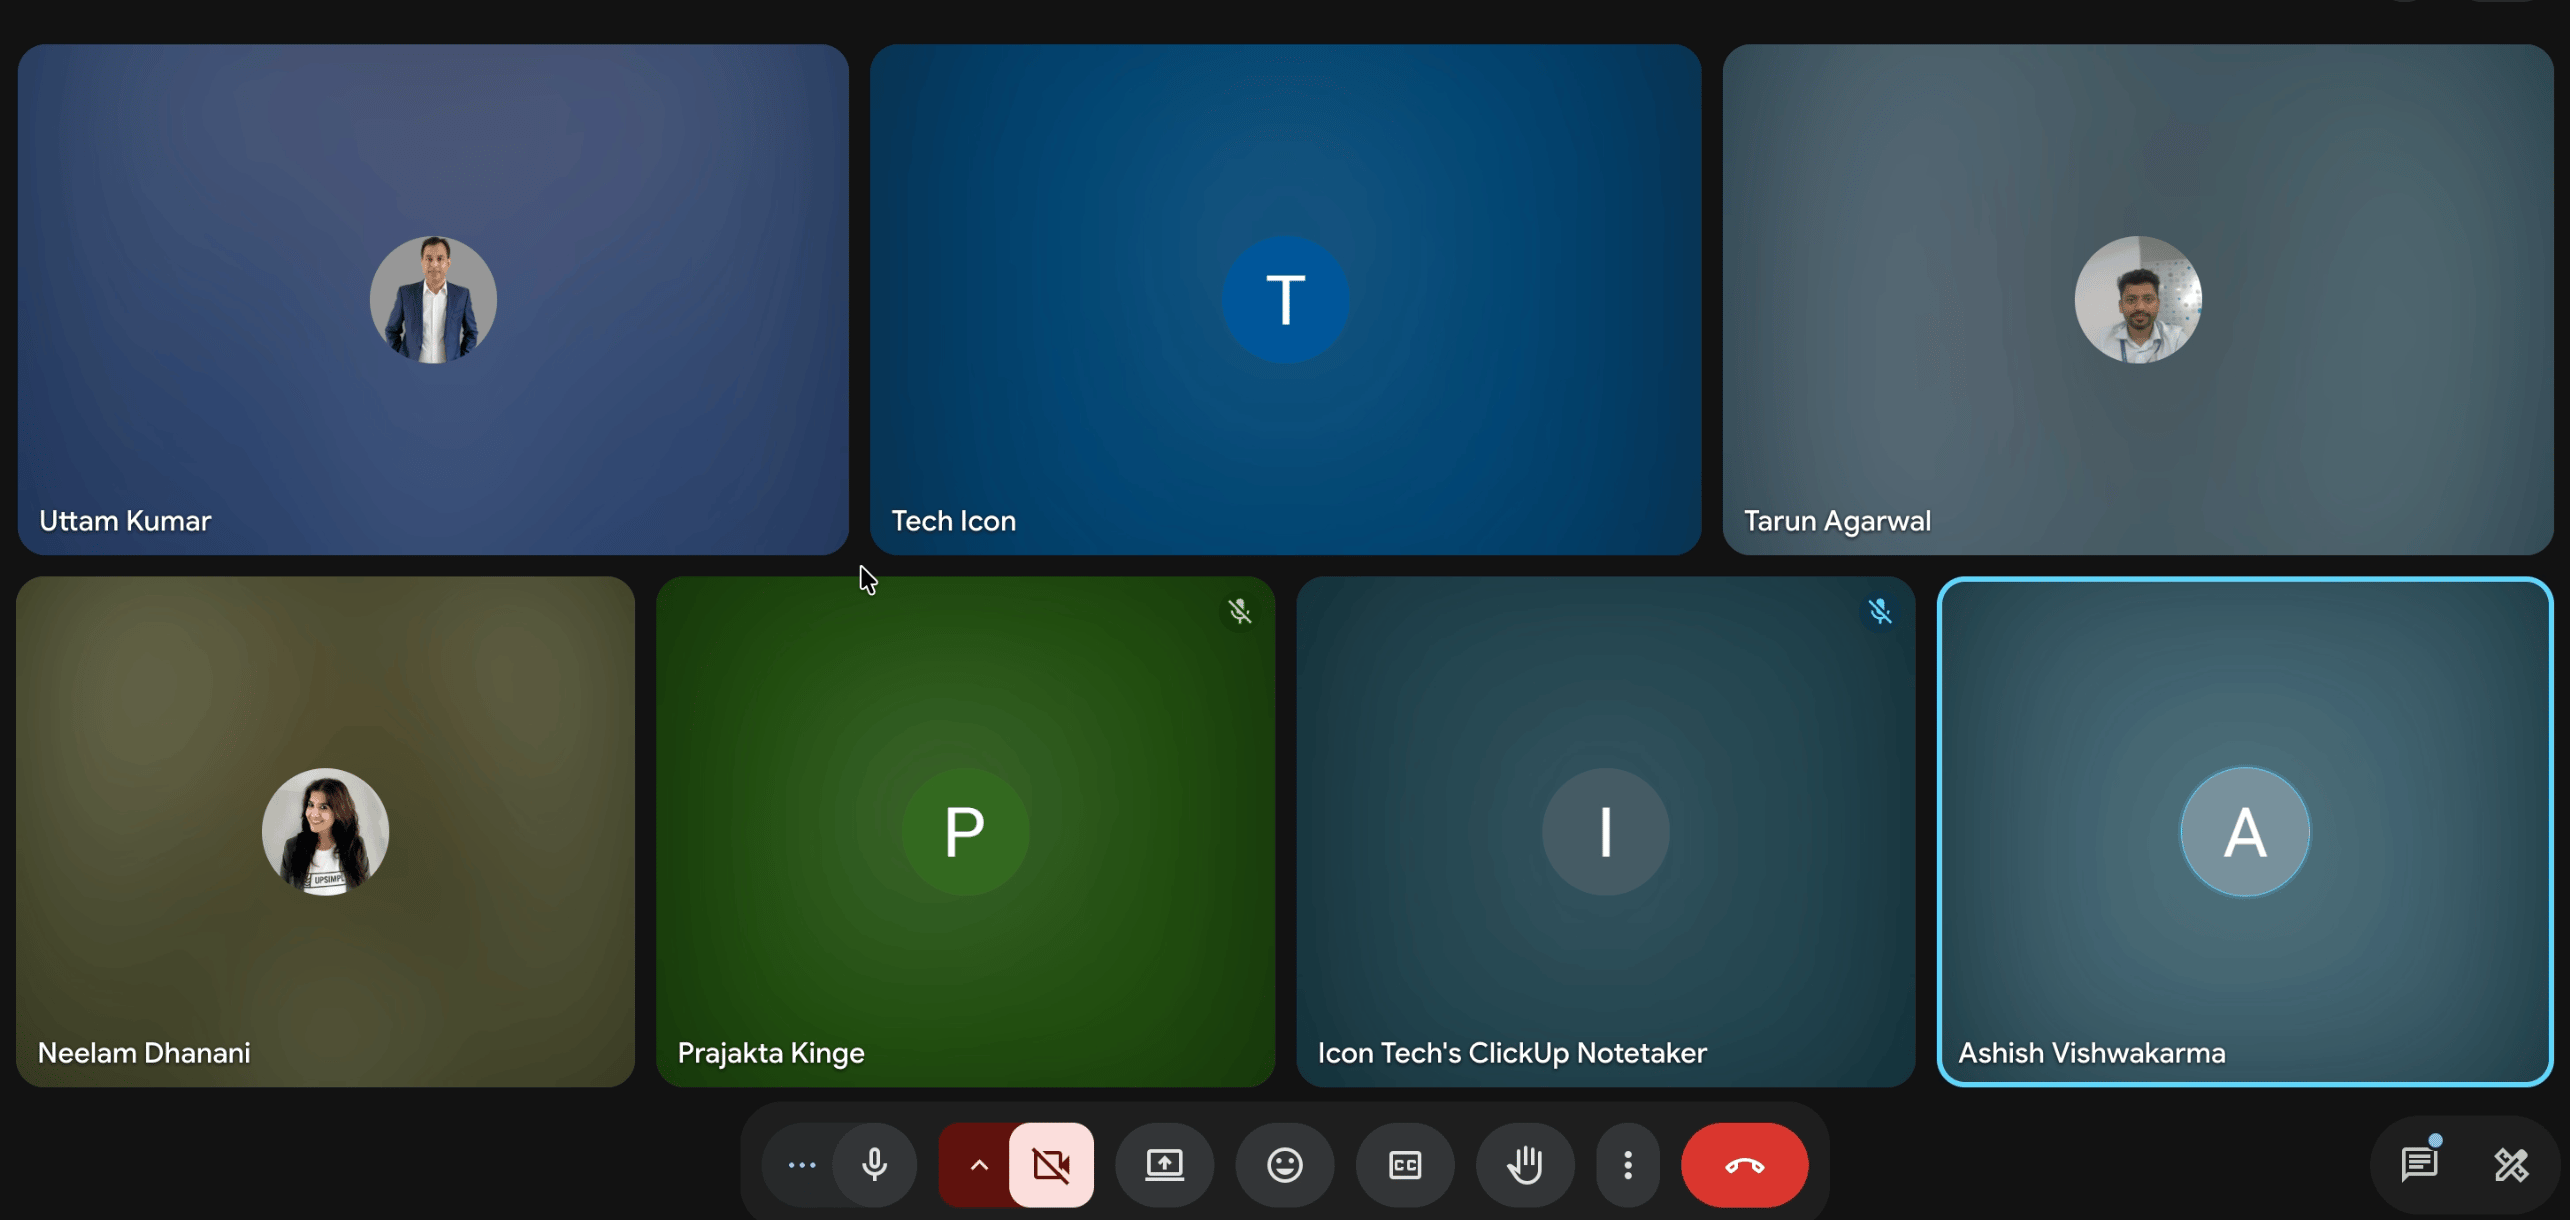
We mapped the existing Maritime Operations ecosystem to understand its information architecture, workflows, modules, dependencies and pain points.
The discovery phase helped us identify opportunities to:
01
Discover
Research & Understand
Interviews, audits & workflow mapping
03
Design
Explore & Validate
Flows, wireframes & prototypes
02
Define
Structure & Prioritize
Insights, IA & opportunity mapping
04
Deliver
Build & Refine
UI, design system & iteration
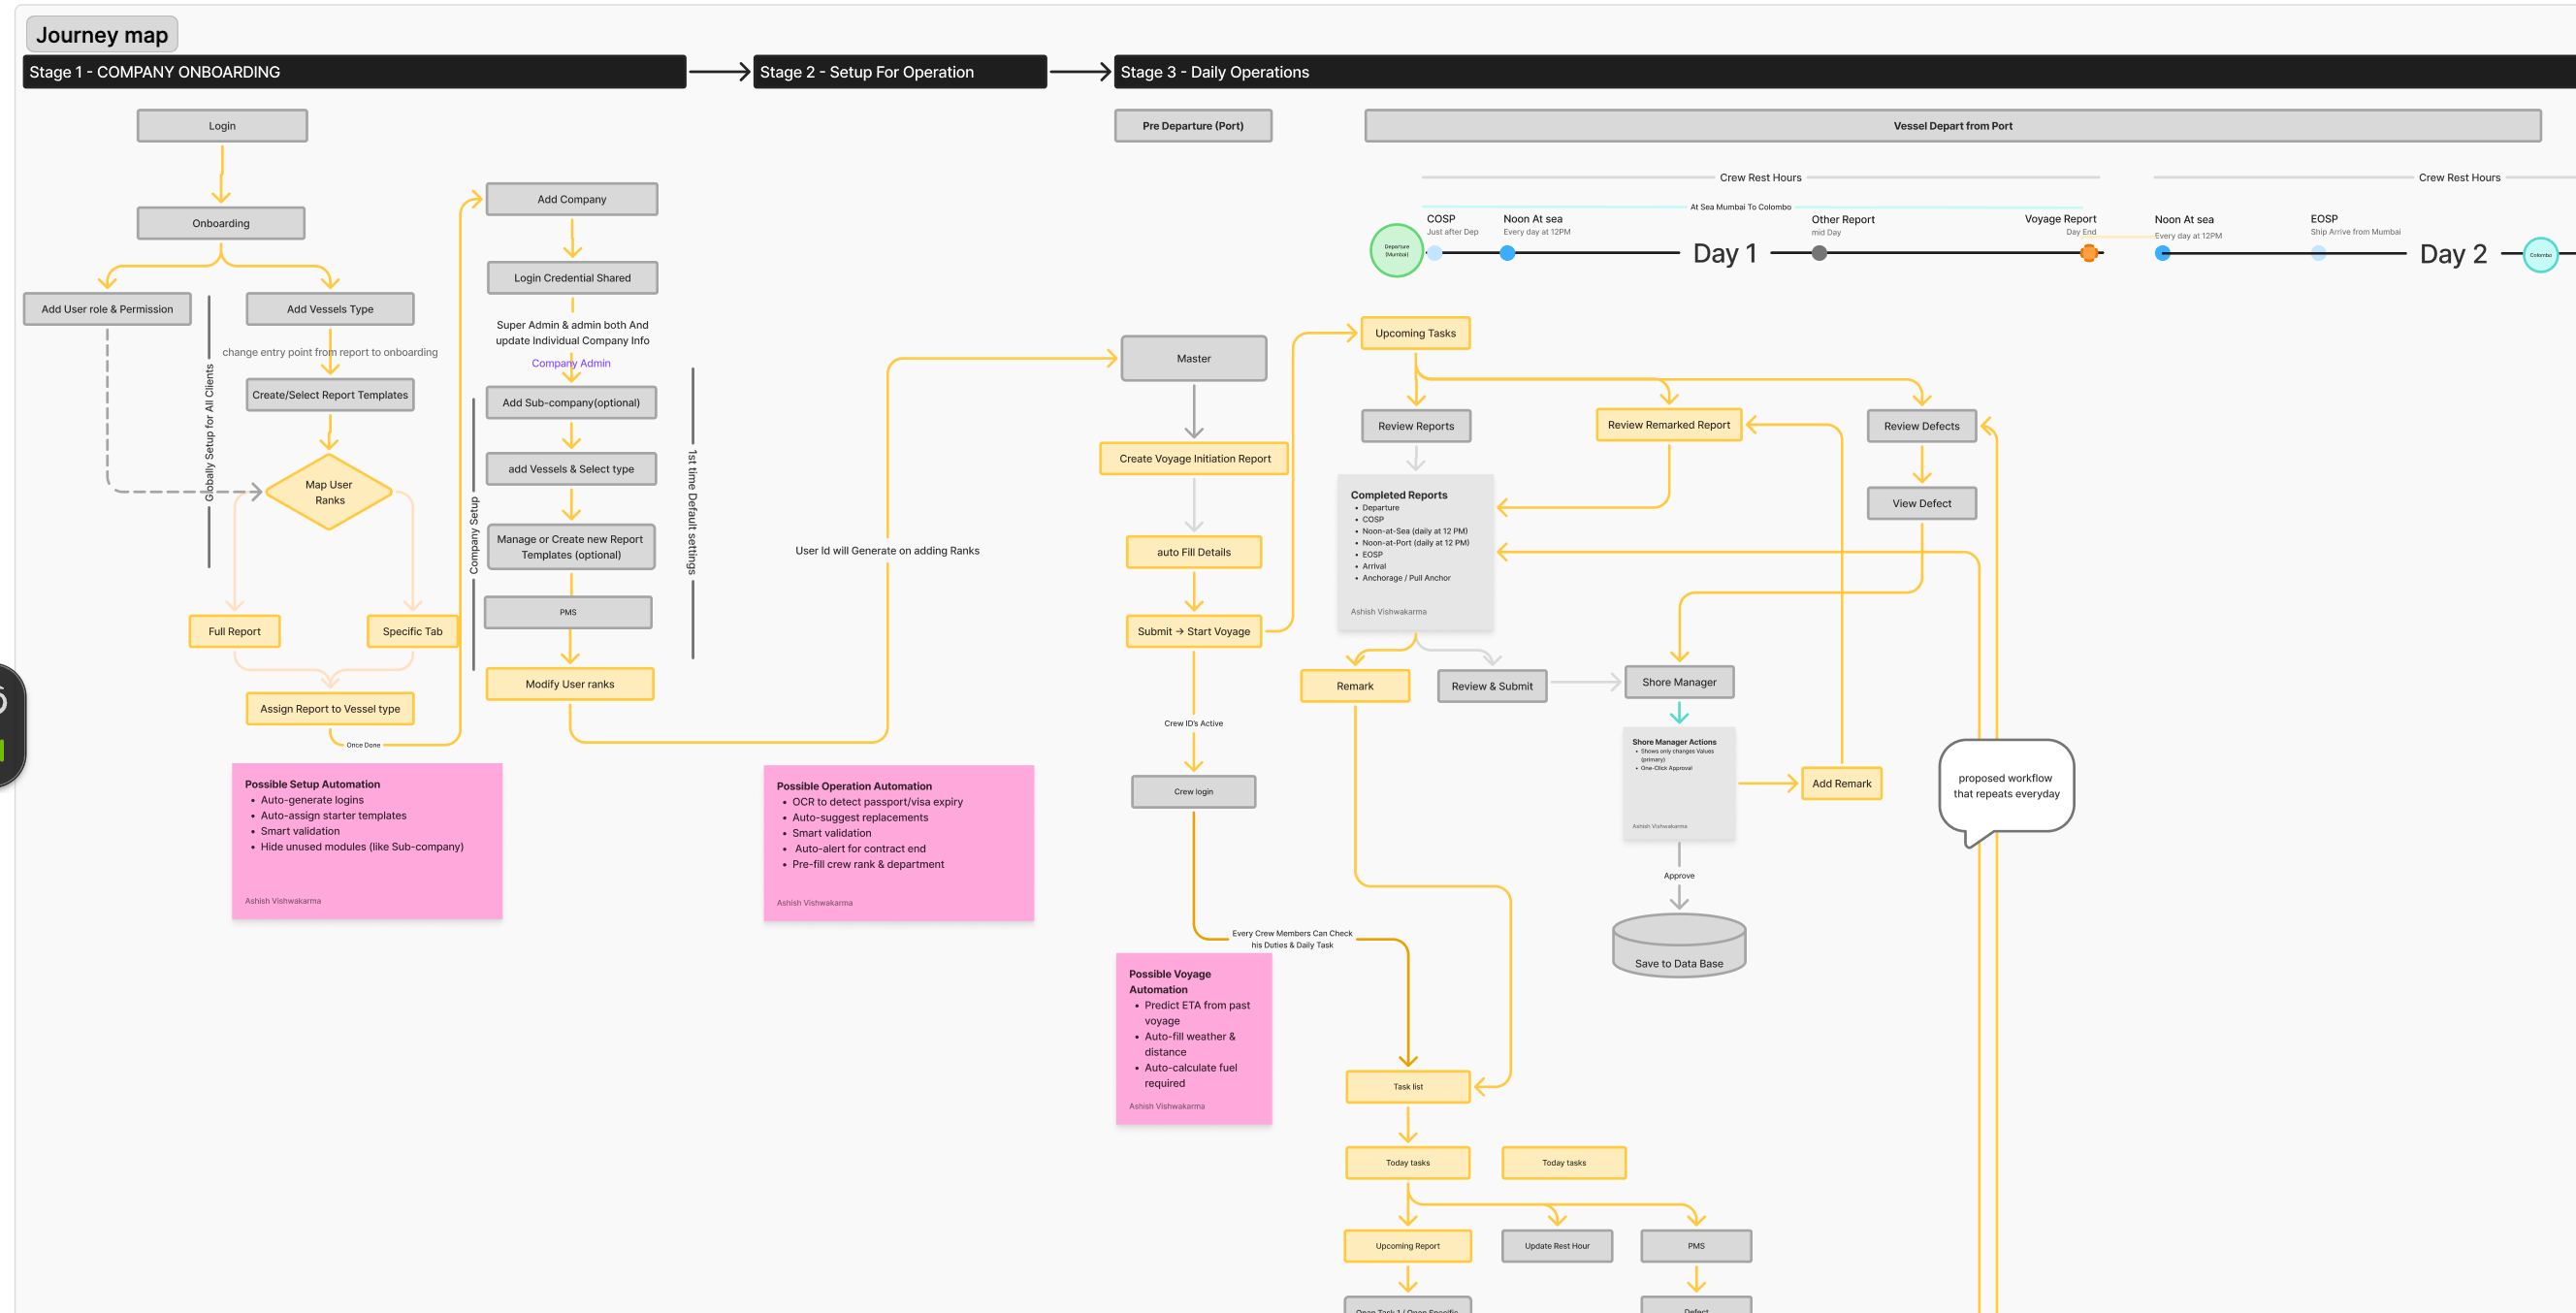
We then translated these findings into a new Fleet Operations structure covering the complete operational journey.
Design Solution
AI-Driven Decision Journey
AI was designed as an assistive layer, not as a replacement for the operator.
01
Data Collection
Bring together reports, vessel data, fuel, weather, machinery and operational information.
02
Data Validation
Identify missing, inconsistent or unusual information before it becomes an operational issue.
03
Contextual Insights
Help users understand what changed and why it matters.
04
Risk & Anomaly Detection
Surface unusual fuel consumption, performance changes, reporting gaps and other potential risks.
05
Actionable Recommendations
Guide users toward the relevant screen or next action instead of simply presenting another alert.
From Complexity to Clarity
We redesigned the core reporting experience around a simple principle:
Fill
→
Review
→
Submit
System knows it
→
Pre-fill it
System can calculate it
→
Calculate it
Something changed
→
Highlight it
Something looks unusual
→
Flag it
User needs to decide
→
Let the operator decide
Reporting Transformation
100–150 fields
→
Logical sections
Repeated information
→
Pre-filled data
Manual calculations
→
Automatic calculations
Long forms
→
Progressive disclosure
Full report checking
→
Exception-focused review
Unclear voyage state
→
Not Started → Active → Completed
Results
Impact & Learning
-40%
Estimated reduction in report completion time
10–12 min
Potential time saved per report
~50%
Estimated reduction in review time
30%
Potential reduction in rework/correction cycles
100–150 → 60–80
Fields requiring active user attention in a typical complex report
Daily Work
How We Helped Operators in Their Daily Work
Before Parternerring with Upsimpl
Enter
→
Check
→
Re-enter
→
Correct
→
Submit
With Partnering with Upsimpl
Open
→
Review
→
Update
→
Resolve
→
Submit
The system takes care of more of the repetitive work, allowing operators to focus on what has changed, what needs attention, and what requires a decision.

Daily Impact
01
Less time spent
filling repetitive information
02
Faster
completion of routine reports
03
Easier
Master review
04
Fewer
avoidable corrections
05
Clearer
communication with shore teams
06
Faster
identification of operational issues
07
Lower cognitive load
during busy onboard operations
Before & After
The Transformation
Before Upsimpl
Fleet Operations
Complex
Difficult to navigate
Data-heavy
Repetitive
After Upsimpl
Fleet Operations
Guided
Connected
Action-driven
Scalable
Scope
What we Designed
01
UX Research
User understanding, pain-point analysis and workflow discovery
02
Information Architecture
Restructured navigation, modules and operational hierarchy
03
End-to-End UX
Voyage, reporting, review, approval and operational workflows
04
Dynamic Forms
Flexible report templates with structured sections and validation
05
Dashboards & Monitoring
Fleet visibility, KPIs, alerts and actionable insights
06
AI-Assisted Experiences
Anomaly detection, insights, recommendations and decision support
07
Design System
Scalable components and patterns for a complex maritime ecosystem
We didn't just redesign the screens.
We redesigned how operators
work with the system every day.
"Let the system handle the repetitive work. Let the operator focus on what matters."

Get started
Ready to scale with a product that holds up?
Book a free consulting call — no pitch deck, just a straight read on where the gap is and what it's costing you.
Book Free Consulting Call

We diagnose user experience friction and design simple, high-converting digital products.
Contact Us


© Upsimpl 2026. All rights reserved.
Fleet Operations
Transforming a complex maritime operations platform into a simpler, smarter, and more connected experience for ship and shore teams.
UX Strategy
Product Design
UX Research
AI-Assisted Workflows
Overview
Fleet Operations is a modern maritime operations platform designed to bring voyage reporting, fleet monitoring, crew operations, compliance, defects, fuel, and performance insights into one connected ecosystem. The project involved redesigning the existing Product experience, which had complex workflows, long reporting forms, repetitive data entry, and limited visibility across daily vessel operations. Our goal was to simplify the experience without removing the operational depth required by maritime teams.
Impact
More connected, action-driven operations ecosystem
Services
UX Strategy · Product Design · UX Research · AI-Assisted Workflows
Maritime Tech
Industry vertical
The Challenge
Maritime Operations had complex workflows, long reporting forms with 100–150 fields, repetitive data entry, and limited visibility across daily vessel operations. Masters and shore teams carried a heavy review workload with no clear signal for what changed or needed attention. The opportunity was to turn a collection of disconnected operational tools into one connected maritime ecosystem.
Connected Ecosystem
12+ Modules. One Connected Experience.
Instead of treating every operational function as a separate product, we created a connected ecosystem across the fleet.


Process
Research and Insights
We mapped the existing Maritime Operations ecosystem to understand its information architecture, workflows, modules, dependencies and pain points.
The discovery phase helped us identify opportunities to:
01
Discover
Research & Understand
Interviews, audits & workflow mapping
03
Design
Explore & Validate
Flows, wireframes & prototypes
02
Define
Structure & Prioritise
Insights, IA & opportunity mapping
04
Deliver
Build & Refine
UI, design system & iteration
We then translated these findings into a new Fleet Operations structure covering the complete operational journey.
Design Solution
AI-Driven Decision Journey
AI was designed as an assistive layer, not as a replacement for the operator.
01
Data Collection
Bring together reports, vessel data, fuel, weather, machinery and operational information.
02
Data Validation
Identify missing, inconsistent or unusual information before it becomes an operational issue.
03
Contextual Insights
Help users understand what changed and why it matters.
04
Risk & Anomaly Detection
Surface unusual fuel consumption, performance changes, reporting gaps and other potential risks.
05
Actionable Recommendations
Guide users toward the relevant screen or next action instead of simply presenting another alert.
From Complexity to Clarity
We redesigned the core reporting experience around a simple principle:
Fill
→
Review
→
Submit
System knows it
→
Pre-fill it
System can calculate it
→
Calculate it
Something changed
→
Highlight it
Something looks unusual
→
Flag it
User needs to decide
→
Let the operator decide
Reporting Transformation
100–150 fields
→
Logical sections
Repeated information
→
Pre-filled data
Manual calculations
→
Automatic calculations
Long forms
→
Progressive disclosure
Full report checking
→
Exception-focused review
Unclear voyage state
→
Not Started → Active → Completed
Results
Impact & Learning
40%
Estimated reduction in report completion time
10–12 min
Potential time saved per report
50%
Estimated reduction in review time
30%
Potential reduction in rework/correction cycles
100–150 → 60–80
Fields requiring active user attention in a typical complex report
Daily Work
How We Helped Operators in Their Daily Work
Before Parternerring with Upsimpl
Enter
→
Check
→
Re-enter
→
Correct
→
Submit
With Partnering with Upsimpl
Open
→
Review
→
Update
→
Resolve
→
Submit
The system takes care of more of the repetitive work, allowing operators to focus on what has changed, what needs attention, and what requires a decision.

Daily Impact
01
Less time spent
filling repetitive information
02
Faster
completion of routine reports
03
Easier
Master review
04
Fewer
avoidable corrections
05
Clearer
communication with shore teams
06
Faster
identification of operational issues
07
Lower cognitive load
during busy onboard operations
Before & After
The Transformation
Before Upsimpl
Fleet Operations
Complex
Difficult to navigate
Data-heavy
Repetitive
After Upsimpl
Fleet Operations
Guided
Connected
Action-driven
Scalable
Scope
What we Designed
01
UX Research
User understanding, pain-point analysis and workflow discovery
02
Information Architecture
Restructured navigation, modules and operational hierarchy
03
End-to-End UX
Voyage, reporting, review, approval and operational workflows
04
Dynamic Forms
Flexible report templates with structured sections and validation
05
Dashboards & Monitoring
Fleet visibility, KPIs, alerts and actionable insights
06
AI-Assisted Experiences
Anomaly detection, insights, recommendations and decision support
07
Design System
Scalable components and patterns for a complex maritime ecosystem
We didn't just redesign the screens.
We redesigned how operators
work with the system every day.
"Let the system handle the repetitive work. Let the operator focus on what matters."


Get started
Ready to scale with a product that holds up?
Book a free consulting call — no pitch deck, just a straight read on where the gap is and what it's costing you.
Book Free Consulting Call
We diagnose user experience friction and design simple, high-converting digital products.
Contact Us

© Upsimpl 2026. All rights reserved.
Fleet Operations
Transforming a complex maritime operations platform into a simpler, smarter, and more connected experience for ship and shore teams.
UX Strategy
Product Design
UX Research
AI-Assisted Workflows
Overview
Fleet Operations is a modern maritime operations platform designed to bring voyage reporting, fleet monitoring, crew operations, compliance, defects, fuel, and performance insights into one connected ecosystem. The project involved redesigning the existing Product experience, which had complex workflows, long reporting forms, repetitive data entry, and limited visibility across daily vessel operations. Our goal was to simplify the experience without removing the operational depth required by maritime teams.
Impact
More connected, action-driven operations ecosystem
Services
UX Strategy · Product Design · UX Research · AI-Assisted Workflows
Maritime Tech
Industry vertical
The Challenge
Maritime Operations had complex workflows, long reporting forms with 100–150 fields, repetitive data entry, and limited visibility across daily vessel operations. Masters and shore teams carried a heavy review workload with no clear signal for what changed or needed attention. The opportunity was to turn a collection of disconnected operational tools into one connected maritime ecosystem.
Connected Ecosystem
12+ Modules. One Connected Experience.
Instead of treating every operational function as a separate product, we created a connected ecosystem across the fleet.

Process
Research and Insights
We mapped the existing Maritime Operations ecosystem to understand its information architecture, workflows, modules, dependencies and pain points.
The discovery phase helped us identify opportunities to:
01
Discover
Research & Understand
Interviews, audits & workflow mapping
03
Design
Explore & Validate
Flows, wireframes & prototypes
02
Define
Structure & Prioritize
Insights, IA & opportunity mapping
04
Deliver
Build & Refine
UI, design system & iteration
We then translated these findings into a new Fleet Operations structure covering the complete operational journey.
Design Solution
AI-Driven Decision Journey
AI was designed as an assistive layer, not as a replacement for the operator.
01
Data Collection
Bring together reports, vessel data, fuel, weather, machinery and operational information.
02
Data Validation
Identify missing, inconsistent or unusual information before it becomes an operational issue.
03
Contextual Insights
Help users understand what changed and why it matters.
05
Actionable Recommendations
Guide users toward the relevant screen or next action instead of simply presenting another alert.
04
Risk & Anomaly Detection
Surface unusual fuel consumption, performance changes, reporting gaps and other potential risks.
From Complexity to Clarity
We redesigned the core reporting experience around a simple principle:
Fill
→
Review
→
Submit
System knows it
→
Pre-fill it
System can calculate it
→
Calculate it
Something changed
→
Highlight it
Something looks unusual
→
Flag it
User needs to decide
→
Let the operator decide
Reporting Transformation
100–150 fields
→
Logical sections
Repeated information
→
Pre-filled data
Manual calculations
→
Automatic calculations
Long forms
→
Progressive disclosure
Full report checking
→
Exception-focused review
Unclear voyage state
→
Not Started → Active → Completed
Results
Impact & Learning
-40%
Estimated reduction in report completion time
10–12 min
Potential time saved per report
~50%
Estimated reduction in review time
30%
Potential reduction in rework/correction cycles
100–150 → 60–80
Fields requiring active user attention in a typical complex report
Daily Work
How We Helped Operators in Their Daily Work
Before Partnering with Upsimpl
Enter
→
Check
→
Re-enter
→
Correct
→
Submit
after Partnering with Upsimpl
Open
→
Review
→
Update
→
Resolve
→
Submit
The system takes care of more of the repetitive work, allowing operators to focus on what has changed, what needs attention, and what requires a decision.

Daily Impact
01
Less time spent
filling repetitive information
02
Faster
completion of routine reports
03
Easier
Master review
04
Fewer
avoidable corrections
05
Clearer
communication with shore teams
06
Faster
identification of operational issues
07
Lower cognitive load
during busy onboard operations
Before & After
The Transformation
Before Upsimpl
Fleet Operations
Complex
Difficult to navigate
Data-heavy
Repetitive
After Upsimpl
Fleet Operations
Guided
Connected
Action-driven
Scalable
Scope
What we Designed
01
UX Research
User understanding, pain-point analysis and workflow discovery
02
Information Architecture
Restructured navigation, modules and operational hierarchy
03
End-to-End UX
Voyage, reporting, review, approval and operational workflows
04
Dynamic Forms
Flexible report templates with structured sections and validation
05
Dashboards & Monitoring
Fleet visibility, KPIs, alerts and actionable insights
06
AI-Assisted Experiences
Anomaly detection, insights, recommendations and decision support
07
Design System
Scalable components and patterns for a complex maritime ecosystem
We didn't just redesign the screens.
We redesigned how operators
work with the system every day.
"Let the system handle the repetitive work. Let the operator focus on what matters."

Get started
Ready to scale with a product that holds up?
Book a free consulting call — no pitch deck, just a straight read on where the gap is and what it's costing you.
Book Free Consulting Call
We diagnose user experience friction and design simple, high-converting digital products.
Contact Us

© Upsimpl 2026. All rights reserved.